
One trick to teach you how to do experiments IC50
IC50 is a commonly use indicator in the fields of biology and pharmacology to measure the level of inhibition or activity of a compound or drug on a biological system. IC50 represents half maximal inhibitory concentration, which refers to the concentration at which a compound or drug can inhibit biological processes or activities under certain conditions, causing the biological processes or activities to be inhibit by 50%.
Typically, IC50 is use to evaluate the antibiological activity of a drug. For example, in drug development, researchers might test the inhibitory effect of a drug on disease-relevant biomolecules (such as enzymes, receptors, or cells) at different concentrations. The lower the IC50 value, the more potent the drug is because it can inhibit the activity of the target biomolecule at a lower concentration.
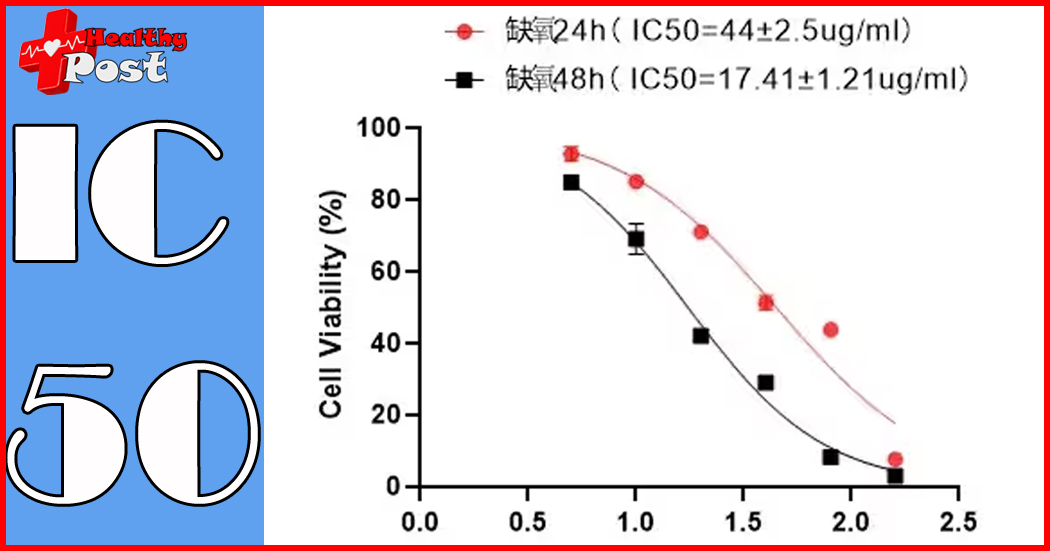
IC50 values are obtained from experimental data
And are usually plot using a concentration-response curve. The IC50 point on the curve represents the half inhibitory concentration, that is, when the concentration reaches the IC50, the biological process or activity is inhibit by 50%. This value is important for drug screening, drug optimization, and understanding interactions between drugs and biomolecules.
IC50 calculation method
Graphpad method
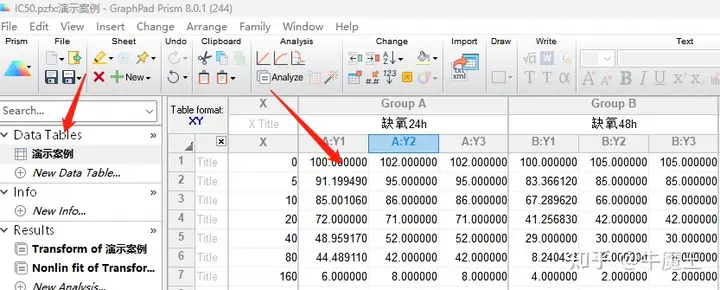
1. Open the Graphpad software, select [XY], select the first graph under [choose a graph], then click Y: Enter 3 replicate values in side-by-side subcolumns, and then click [creat ];
2. Click [Data Tables] to enter data in the table
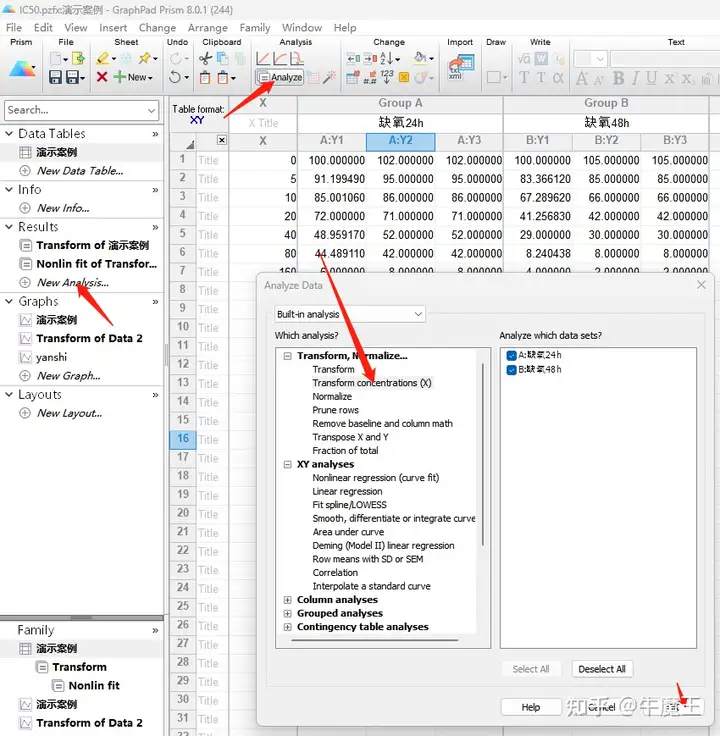
3. Click [analysis], select: Transform concentration (X) in the options, select: Transform concentration (X) in the options
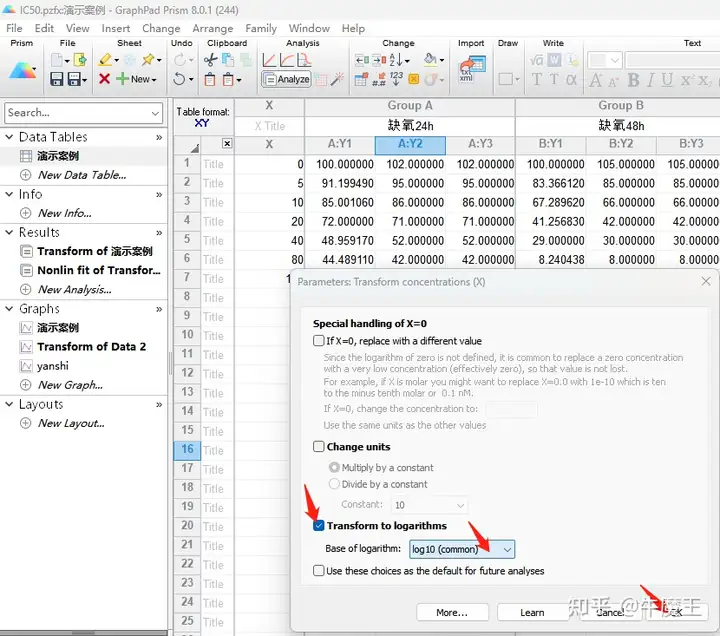
4. Click OK, select Transform to logarithms in the pop-up interface, select log10 (common), and click OK
5. Click the [analysis data] dialog box again. In the [analysis data] dialog box, click Nonlinear regression (curve fit) under [XY];
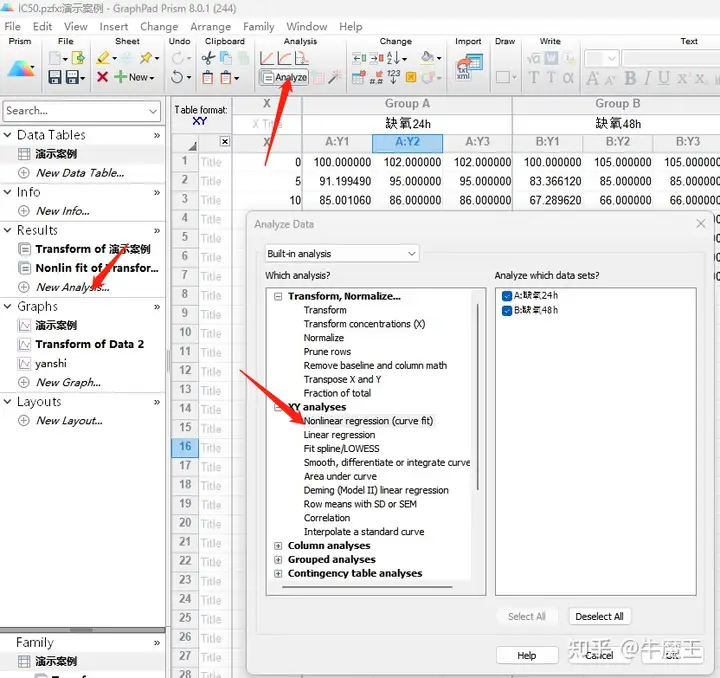
3. Select [loginhibitors VS normalized response-Variable slope] under [dose-response-inhibition] and click [ok];
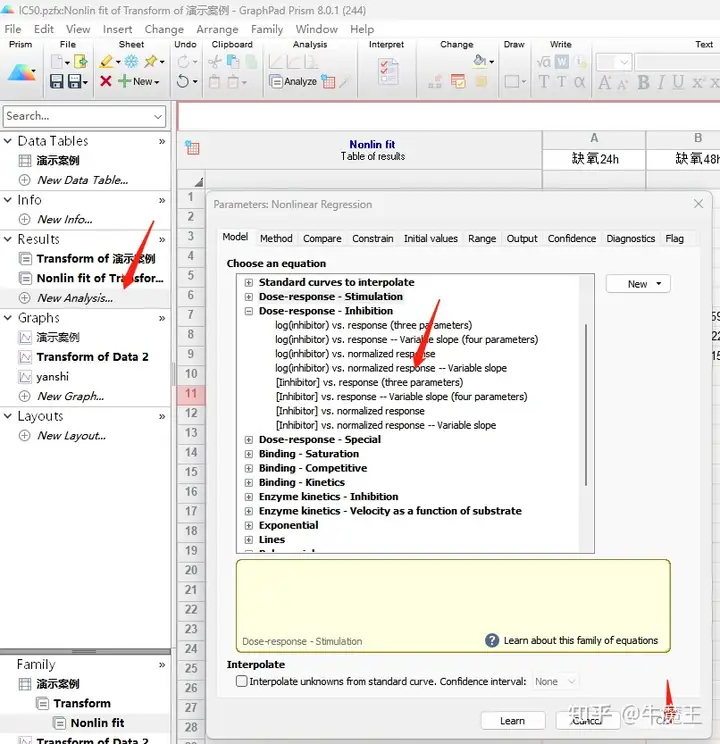
4. In the pop-up dialog box, check the IC50 value.
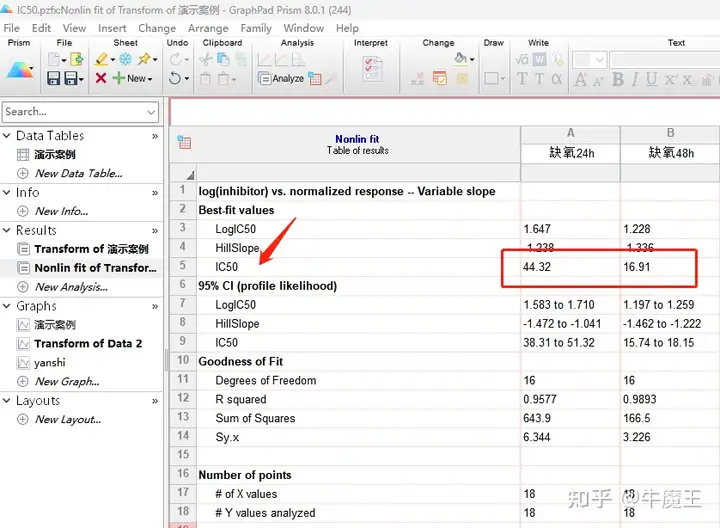
The method is that the 95 confidence interval is (x-1.96SE, x+1.96SE). According to the confidence interval (a, b) obtain by GraphPad fitting analysis, the mean x and standard deviation SE can be find by solving an equation.